Repository Analytics & Reporting Guide

The Repository provides comprehensive analytics and reporting features to help you track repository health, analyze test coverage, and monitor trends over time. Use these insights to make data-driven decisions about your test case management.

Repository Analytics

Accessing Analytics

To view repository analytics:

  1. Navigate to the Repository page.

  2. Click the “Analytics” button in the header.

  3. A modal will display comprehensive analytics.

  4. Analytics are calculated for:

    • All test cases in the repository (if no folder selected)
    • Test cases in the selected folder (if a folder is selected)

Overview Metrics

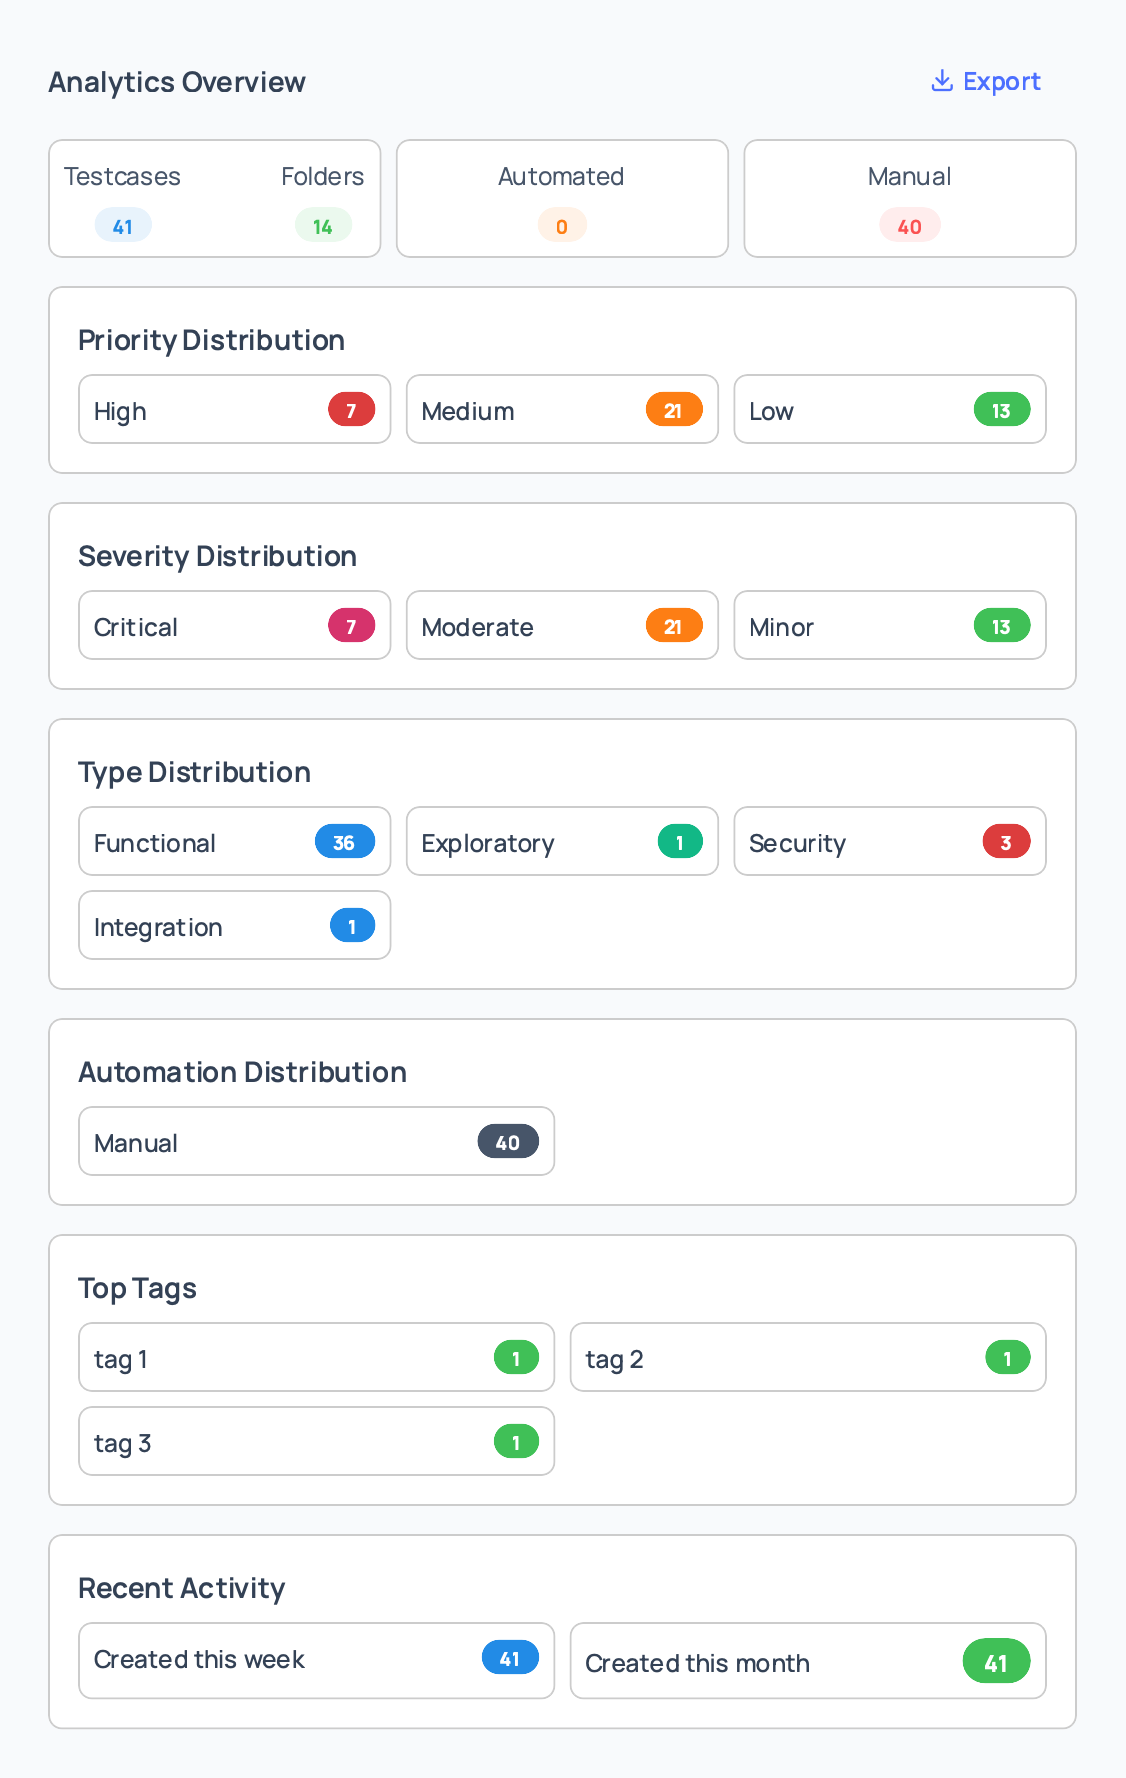
The analytics overview shows key metrics:

Total Test Cases:

  • Number of test cases in the repository or selected folder
  • Includes all test cases regardless of status

Total Folders:

  • Number of folders in the repository or selected folder
  • Includes nested folders

Automated vs Manual:

  • Count of automated test cases
  • Count of manual test cases
  • Percentage distribution

Test Case Distribution:

  • Breakdown by various categories
  • Visual representation of distribution

Distribution Charts

Analytics include distribution charts for:

Priority Distribution:

  • Shows count of test cases by priority level
  • Categories: Critical, High, Medium, Low
  • Helps identify priority balance

Severity Distribution:

  • Shows count of test cases by severity level
  • Categories: Critical, High, Medium, Low
  • Helps assess risk coverage

Type Distribution:

  • Shows count of test cases by type
  • Categories: Functional, Regression, Smoke, etc.
  • Helps understand test type balance

Automation Status Distribution:

  • Shows automated vs manual test cases
  • Helps track automation progress

Tags Distribution:

  • Shows most common tags
  • Helps understand test case categorization
  • Identifies popular tags

Recent Activity

The analytics include recent activity information:

Recently Created Test Cases:

  • List of recently created test cases
  • Shows creation date and creator
  • Helps track recent additions

Recently Updated Test Cases:

  • List of recently updated test cases
  • Shows update date and updater
  • Helps track maintenance activity

Recent Folder Changes:

  • Recent folder creation and updates
  • Helps track organizational changes

Exporting Analytics

To export analytics data:

  1. View the analytics modal.

  2. Click “Export Analytics” button.

  3. Analytics data is downloaded as a JSON file.

  4. The exported file includes:

    • Overview metrics
    • Distribution data
    • Recent activity
    • Timestamp and folder information
  5. Use the exported data for:

    • External reporting
    • Data analysis
    • Historical tracking
    • Integration with other tools

Test Coverage Report

Accessing Coverage Report

To view test coverage:

  1. Navigate to the Repository page.

  2. Click the “Coverage” button in the header.

  3. A modal will display coverage metrics.

Coverage Metrics

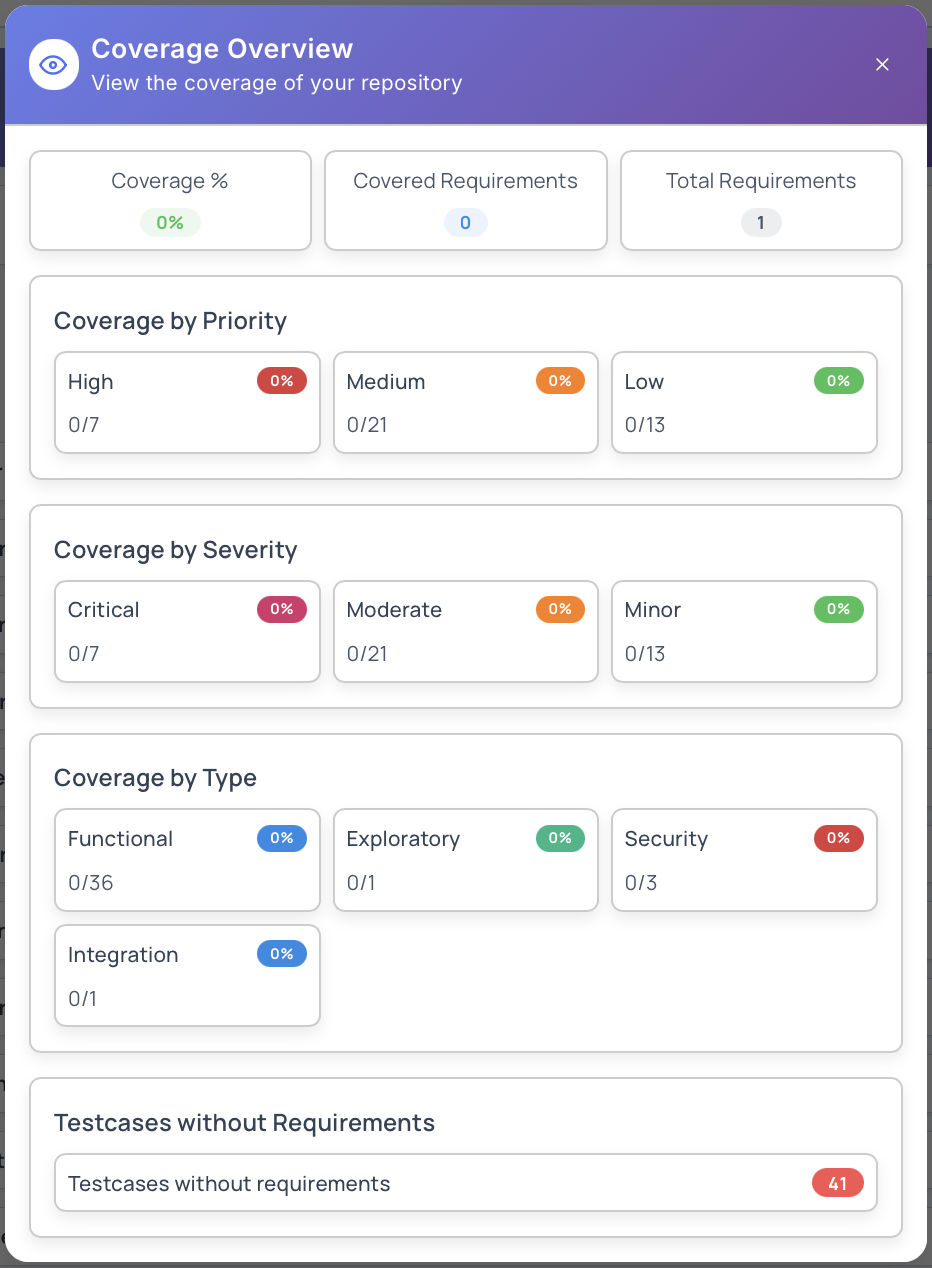
The coverage report shows:

Requirement Coverage:

  • Percentage of requirements covered by test cases
  • Total requirements vs covered requirements
  • Visual coverage indicator

Coverage by Requirement:

  • Detailed coverage per requirement
  • Shows which requirements have test cases
  • Identifies coverage gaps

Uncovered Requirements:

  • List of requirements without test cases
  • Helps identify gaps in test coverage
  • Prioritize test case creation

Coverage Trends:

  • Historical coverage data
  • Shows coverage changes over time
  • Helps track coverage improvements

Using Coverage Data

Coverage data helps you:

  1. Identify Gaps: Find requirements without test cases
  2. Prioritize Testing: Focus on uncovered requirements
  3. Track Progress: Monitor coverage improvements
  4. Report to Stakeholders: Share coverage metrics
  5. Plan Testing: Plan test case creation for uncovered areas

Trend Analysis

Accessing Trend Analysis

To view trend analysis:

  1. Access trend analysis from the analytics modal.

  2. Select a time range:

    • Week: Last 7 days
    • Month: Last 30 days
    • Quarter: Last 90 days
    • Year: Last 365 days
    • Custom: Select custom date range
  3. View trends for various metrics.

Trend Metrics

Trend analysis shows trends for:

Test Case Creation:

  • Number of test cases created over time
  • Creation rate trends
  • Identifies periods of high activity

Test Case Updates:

  • Number of test cases updated over time
  • Update frequency trends
  • Shows maintenance activity

Folder Creation:

  • Number of folders created over time
  • Organizational growth trends

Test Case Distribution Changes:

  • Changes in test case distribution over time
  • Type, priority, severity trends
  • Helps identify shifts in testing focus

Custom Date Range

To use custom date range:

  1. Select “Custom” from the time range dropdown.

  2. Select start and end dates using date pickers.

  3. View trends for the selected period.

  4. Compare different time periods.

Analytics Best Practices

Regular Monitoring

  1. Schedule Reviews: Review analytics regularly (weekly or monthly)
  2. Track Trends: Monitor trends over time
  3. Set Goals: Set targets for metrics
  4. Compare Periods: Compare current period with previous periods

Using Analytics Data

  1. Identify Issues: Use analytics to identify problems
  2. Make Decisions: Make data-driven decisions
  3. Plan Improvements: Plan improvements based on insights
  4. Report Progress: Share analytics with stakeholders

Coverage Management

  1. Track Coverage: Regularly check requirement coverage
  2. Fill Gaps: Create test cases for uncovered requirements
  3. Maintain Coverage: Keep coverage high as requirements change
  4. Report Coverage: Include coverage in status reports

Trend Analysis

  1. Monitor Trends: Track trends over time
  2. Identify Patterns: Look for patterns in the data
  3. Plan Resources: Use trends to plan resource allocation
  4. Predict Needs: Use trends to predict future needs

Reporting Use Cases

Status Reports

Creating status reports:

  1. Export analytics data.

  2. Create reports showing:

    • Test case counts
    • Coverage metrics
    • Recent activity
    • Trends
  3. Share with stakeholders.

Planning

Using analytics for planning:

  1. Review distribution charts.

  2. Identify areas needing more test cases.

  3. Plan test case creation.

  4. Allocate resources.

Quality Assurance

Using analytics for QA:

  1. Monitor test case quality.

  2. Track coverage.

  3. Identify gaps.

  4. Improve test case management.

Permissions

Access to analytics depends on your role:

  • Project Owner: Full access to all analytics
  • Project Administrator: Can view all analytics
  • Project Manager: Can view analytics
  • Tester: Can view basic analytics
  • Viewer: Read-only access to analytics

Note: Analytics respect folder access permissions. You can only see analytics for folders you have access to.

Next Steps

Was this page helpful?