Observatory Panels Overview - Analytics Guide
Panels are dashboards that organize multiple charts into a single, cohesive analytics view. They help you group related metrics, focus on specific insights, and review test data in a structured and repeatable way.
Panels are the primary way analytics are consumed inside Observatory.
What Are Panels?
Panels are used to structure and organize analytics.
They act as:
- Dashboard Containers – Hold multiple charts in one place
- Logical Groupings – Combine related metrics and visualizations
- Focused Views – Present insights for a specific purpose or audience
- Reusable Layouts – Revisit the same analytics view over time
Instead of viewing individual charts in isolation, panels let you build dashboards that tell a story.
Viewing Panels
Panels List
The Panels page displays all available panels in a grid layout.
Each panel appears as a panel card, providing a quick overview of what the dashboard contains.
Panel Card Information
Each panel card includes:
- Title – The name of the panel
- Description – A short summary (truncated if long)
- Chart Count – Number of charts inside the panel (for example, “4 Charts”)
- Actions Menu – Options to edit or delete the panel
This view helps you quickly scan, identify, and open the dashboards you need.
Creating Panels
Panels are created before adding charts. A panel defines the dashboard container that charts live inside.
- Click the Create Panel button on the Panels page
- The Create Panel modal opens
- Fill in the panel details:
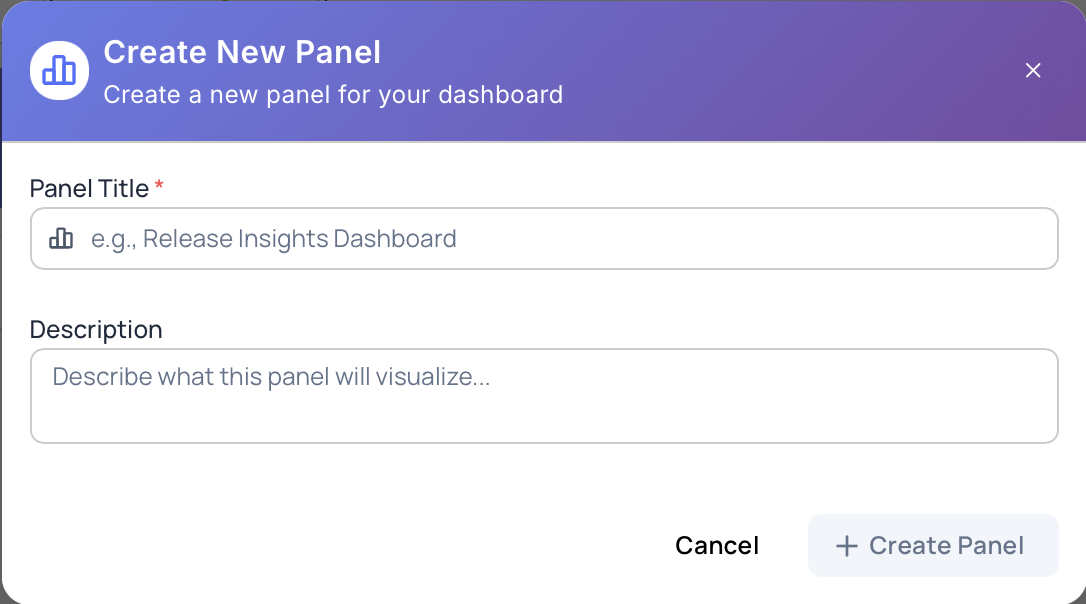
Name
A clear, descriptive name for the panel.
This is shown on the panel card and dashboard header.
Description
A short summary describing the purpose of the panel.
This helps others understand what insights the panel provides.
- Click Create Panel
The panel is created and appears in the panels list.
You can now open the panel and start adding charts.
Opening a Panel
To open a panel:
- Click on a panel card from the panels list
- The panel dashboard opens
- All charts within the panel are displayed together
- Use the back navigation to return to the panels list
Panel Dashboard
When a panel is opened, it becomes a dashboard view for its charts.
Header
- Panel title
- Back navigation to the panels list
- Add Chart button to create new charts inside the panel
Charts Grid
- Displays all charts in the panel
- Responsive layout:
- Two columns on larger screens
- Single column on smaller screens
- Charts are interactive and update automatically as data changes
Empty State
- Shown when a panel has no charts
- Provides guidance and a clear action to add the first chart
When to Use Panels
Panels are especially useful when you want to:
- Group related metrics into a single view
- Create dashboards for different audiences (QA leads, managers, teams)
- Track trends and insights over time
- Review analytics regularly using a consistent layout
- Avoid switching between multiple individual charts
Next Steps
- Learn how to Create & Manage Panels
- Review Panel Organization Best Practices
- Explore Charts to build visualizations
- Read the Observatory Overview for the complete analytics model